Logging in Bonita components
Learn how to view and configure logging of Bonita components.
How components produce log messages
Bonita components have their own ways to produce logs, as described below.
Bonita Runtime
The Bonita Runtime has two components :
-
Bonita Engine, which uses SLF4J in order to write log messages.
-
Bonita Rest APIs, which use Java Url Logging (JUL)
Bonita Studio
The Studio uses a logging service provided by the Eclipse platform. Modification of the Studio logging configuration is not very common except for debugging the Studio itself.
The Bonita Studio provides direct access to the log written by the embedded Runtime. You can access this log from the Bonita Studio Help menu Show Engine log option (Engine log also contains UI designer logs).
Logging configuration
Bonita Runtime
Bonita Engine uses SLF4J to create the logs as well as some Bonita dependencies such as Quartz and Ehcache.
SLF4J is a facade for various logging frameworks, and a logging framework must be available as the back-end. By default, Bonita uses JUL (Java Util Logging) as a the back-end to SLF4J.
By default, in the Bonita Runtime, all logs are sent to the Log4j2 logger. To configure what is logged and where it is stored, edit the log4j2-loggers.xml and log4j2-appenders.xml file located in conf folder of the Bonita Bundle.
See Log4j website
For the Bonita Runtime embedded in the Bonita Studio, the Log4j2 configuration files are located in the Studio installation folder under
workspace/tomcat/conf. After editing this file, Log4j2 should automatically reload the configuration without having to restart.
Here is an example of the Log4j2 configuration for the logger used in the example below:
<!-- Set log level to "TRACE" for newly created connector -->
<Logger name="org.mycompany.connector" level="TRACE"/>
<!-- Set log level to "TRACE" for Groovy script -->
<Logger name="org.bonitasoft.groovy.script" level="TRACE"/>
Bonita Runtime uses Mapped Diagnostic Context (MDC) to bring contextual information into your logs. You can configure the log pattern with the LOG_PATTERN property. The default value is:
<Property name="LOG_PATTERN">%highlight{%d{ISO8601_OFFSET_DATE_TIME_HHMM} | ${hostName} | %-5p%notEmpty{[%marker]} | [%t|%T] %c{1.} - %m%notEmpty{ - %X}%n}{FATAL=Bright red, ERROR=red, WARN=yellow bold, INFO=Normal, DEBUG=green bold, TRACE=blue}</Property>%X brings all the contextual information in the log. You can also write your own pattern to pick specific information. E.g. use %X{userId} to get the id of the authenticated user. All the usable variables such as userId are in the MDCConstants class.
HTTP Request tracing configuration
Troubleshooting HTTP requests can be challenging, especially in distributed systems. To simplify tracing, each HTTP request is now identified by a requestId attached to the request. For distributed systems, a correlationId can be used to identify a transaction. By default, the custom HTTP headers used to trace a request are:
req.requestId.attributeName             track.requestId
req.requestId.headerName                X-Request-ID
req.correlationId.attributeName         track.correlationId
req.correlationId.headerName            X-Correlation-ID
These properties can be updated in the console-config.properties file. You need to use the setup tool provided in workspace/tomcat/setup/ to update console-config.properties.
Use JSON format for logs
The default configuration contains an unused Console-JSON appender which formats logs as JSON.
    <Appenders>
        <!-- use json logger if json output is required -->
        <Console name="Console-JSON" target="SYSTEM_OUT">
            <JSONLayout compact="true" eventEol="true" properties="true" stacktraceAsString="true">
                <KeyValuePair key="timestamp" value="$${date:yyyy-MM-dd'T'HH:mm:ss.SSSZ}"/>
            </JSONLayout>
        </Console>
        <!-- [...] -->
    </Appenders>
To use it, you can update the AppenderRef in the Loggers block or add a new one.
    <Loggers>
        <Root level="INFO">
            <AppenderRef ref="Console-JSON"/>
        </Root>
    </Loggers>
Stream logs to a remote server
You need to declare a Socket appender in log4j-appenders.xml to stream to a remote server. You can choose to use Socket with various formats, such as JSONLayout or PatternLayout.
As example, this configuration is used to stream JSON-formatted log entries to a remote server, such as Logstash, for further processing and analysis.
<Socket name="runtimeLogSocket" host="<host>" port="<port>">
    <JSONLayout compact="true" eventEol="true" properties="true" stacktraceAsString="true">
        <KeyValuePair key="timestamp" value="$${date:yyyy-MM-dd'T'HH:mm:ss.SSSZ}"/>
    </JSONLayout>
</Socket>
Then, do not forget to reference this new appender in Loggers block:
    <Loggers>
        <Root level="INFO">
            <!-- [...] -->
            <AppenderRef ref="runtimeLogSocket"/> <!-- Add this AppenderRef -->
            <!-- [...] -->
        </Root>
</Loggers>How to use a Logger in your development on Bonita
When you write Groovy scripts or Java code to be included in a process (for example, to create a new connector implementation), logging is usually required. The recommended option is to use SLF4J in order to log messages. SLF4J API is included in the Bonita dependencies so you can use it without adding extra dependencies.
This is an example of how to log debug information in a Groovy script. Note that we recommend that you use a logger name that starts with "org.bonitasoft", so that the default Bonita logging configuration is applied to your logger. Also, ending your logger name with a name similar to the Groovy script will be helpful to identify source of the message.
import org.slf4j.Logger
import org.slf4j.LoggerFactory

Logger logger = LoggerFactory.getLogger("org.bonitasoft.groovy.script.my_int_init_script")
logger.debug("Set initial value of process variable using Groovy script")
return Integer.valueOf(3 + 5)
This is an example of how to use logging in a connector:
final Logger LOGGER = LoggerFactory.getLogger(SumImpl.class)

@Override
protected void executeBusinessLogic() throws ConnectorException {
    LOGGER.debug("Trying to sum {} and {}.", getIntegerA(), getIntegerB())
    int sum = getIntegerA() + getIntegerB()
    LOGGER.debug("The sum is: {}", sum)
    setSum(sum)
}
View log content
Bonita Studio
In Bonita Studio you have access to the following log files :
-
The Studio log file includes information about Studio execution. Look at this file if you see incorrect behavior of the Studio. To view the file, go to the Help menu and choose Show Studio log. The file is located in the
workspace/.metadatafolder and is named.log. -
The Runtime log file receives all log messages produced by the Bonita Platform embedded in the Studio. When you test your processes by running them from the Studio you will find valuable debugging information in this file. To view the file, go to the Help menu and choose Show Engine log. The file is located in
workspace/tomcat/logand is namedbonita-yyyy-mm-dd.log.
Integrate Bonita Runtime logs into an external Log Management System
You can exploit the Mapped Diagnostic Context (MDC) information from the Bonita Runtime log to integrate it in an external Log Management System.
These instructions demonstrate how to do it with Eclipse Trace Compass a free and open source traces and logs manager. You can adapt these to your favorite tool of choice.
|
This demo uses the textual log. If you prefer to use the JSON log format, you will find all the contextual information in the |
-
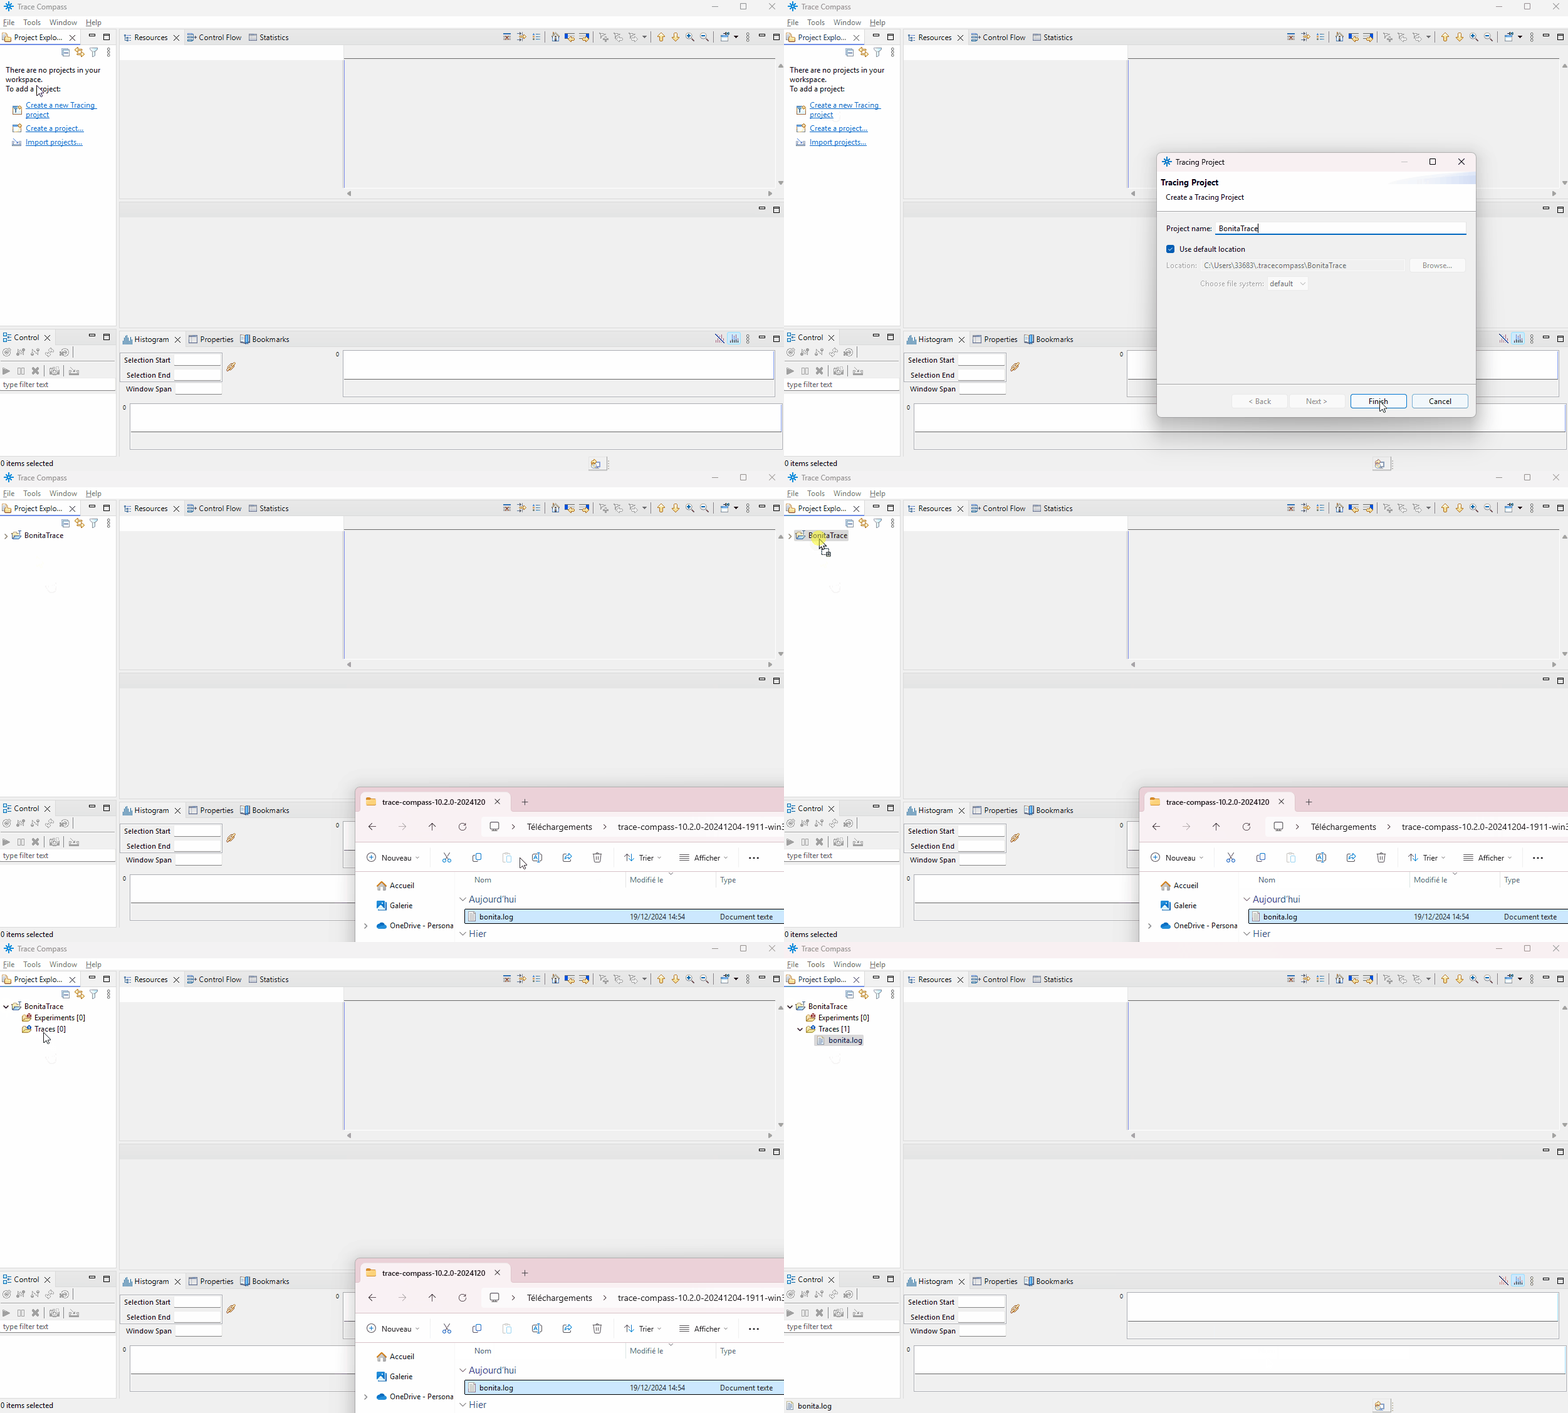
Download, install and launch Trace Compass.
-
Create a new project. Import your logs file in the Traces.

-
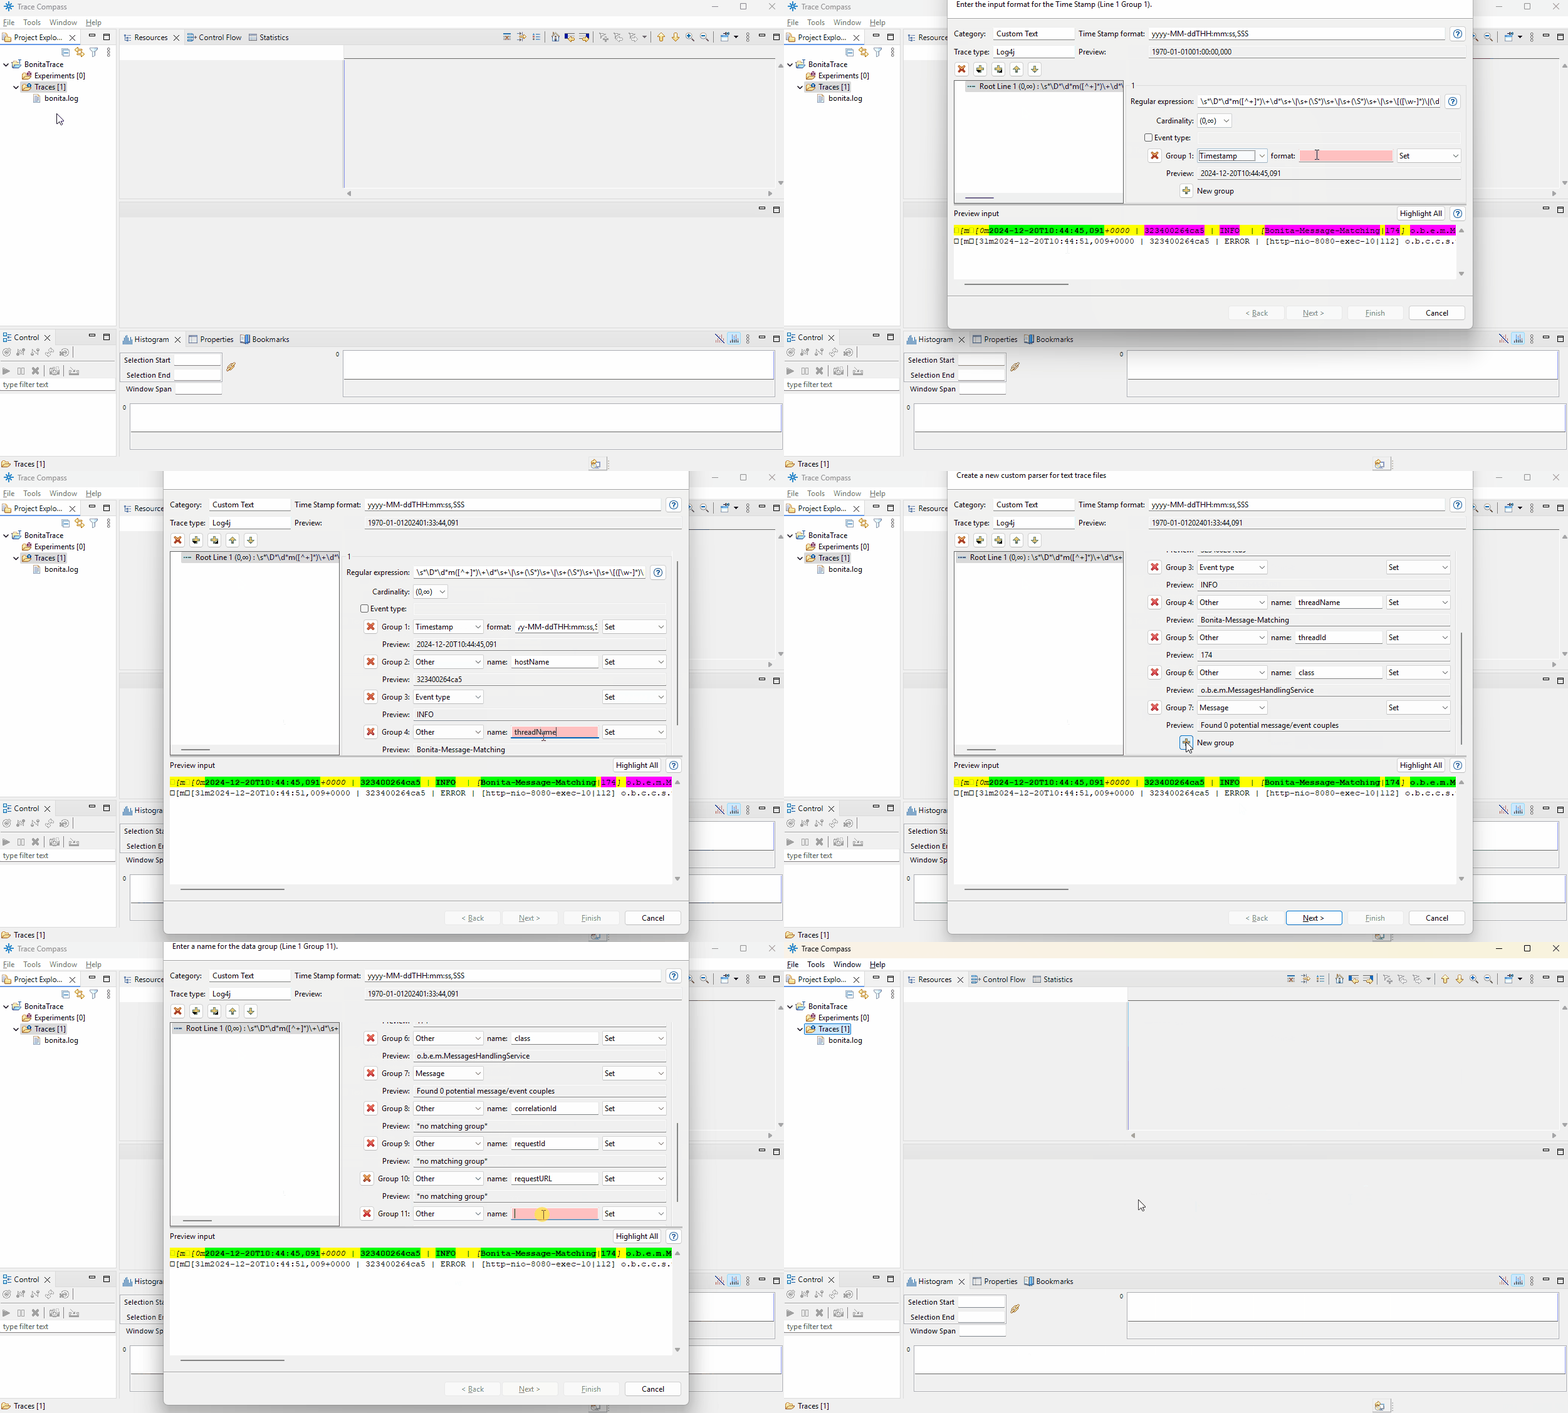
Create a custom parser to parse the log4j lines.
With the defaultLOG_PATTERNproperty, you can use this pattern in Trace Compass (adapt it otherwise):\s*\D*\d*m([^+]*)\+\d*\s+\|\s+(\S*)\s+\|\s+(\S*)\s+\|\s+\[([\w-]*)\|(\d*)\]\s*([\w\.]*)\s*\-\s*(.*?)(?: \- \{(?:req.correlationId=(\w*)|req.requestId=(\w*)|req.requestURL=(\S*)|txUid=([\w:]*)|userId=([\d]*)|rootProcessInstanceId=([\d]*)|.*?)+\})?You can add/remove as many
propertyName=([…]*)|blocks as you want to match MDC variables from the MDCConstants class.
Useyyyy-MM-ddTHH:mm:ss,SSSfor Time Stamp value. Test your pattern on an example log line.
-
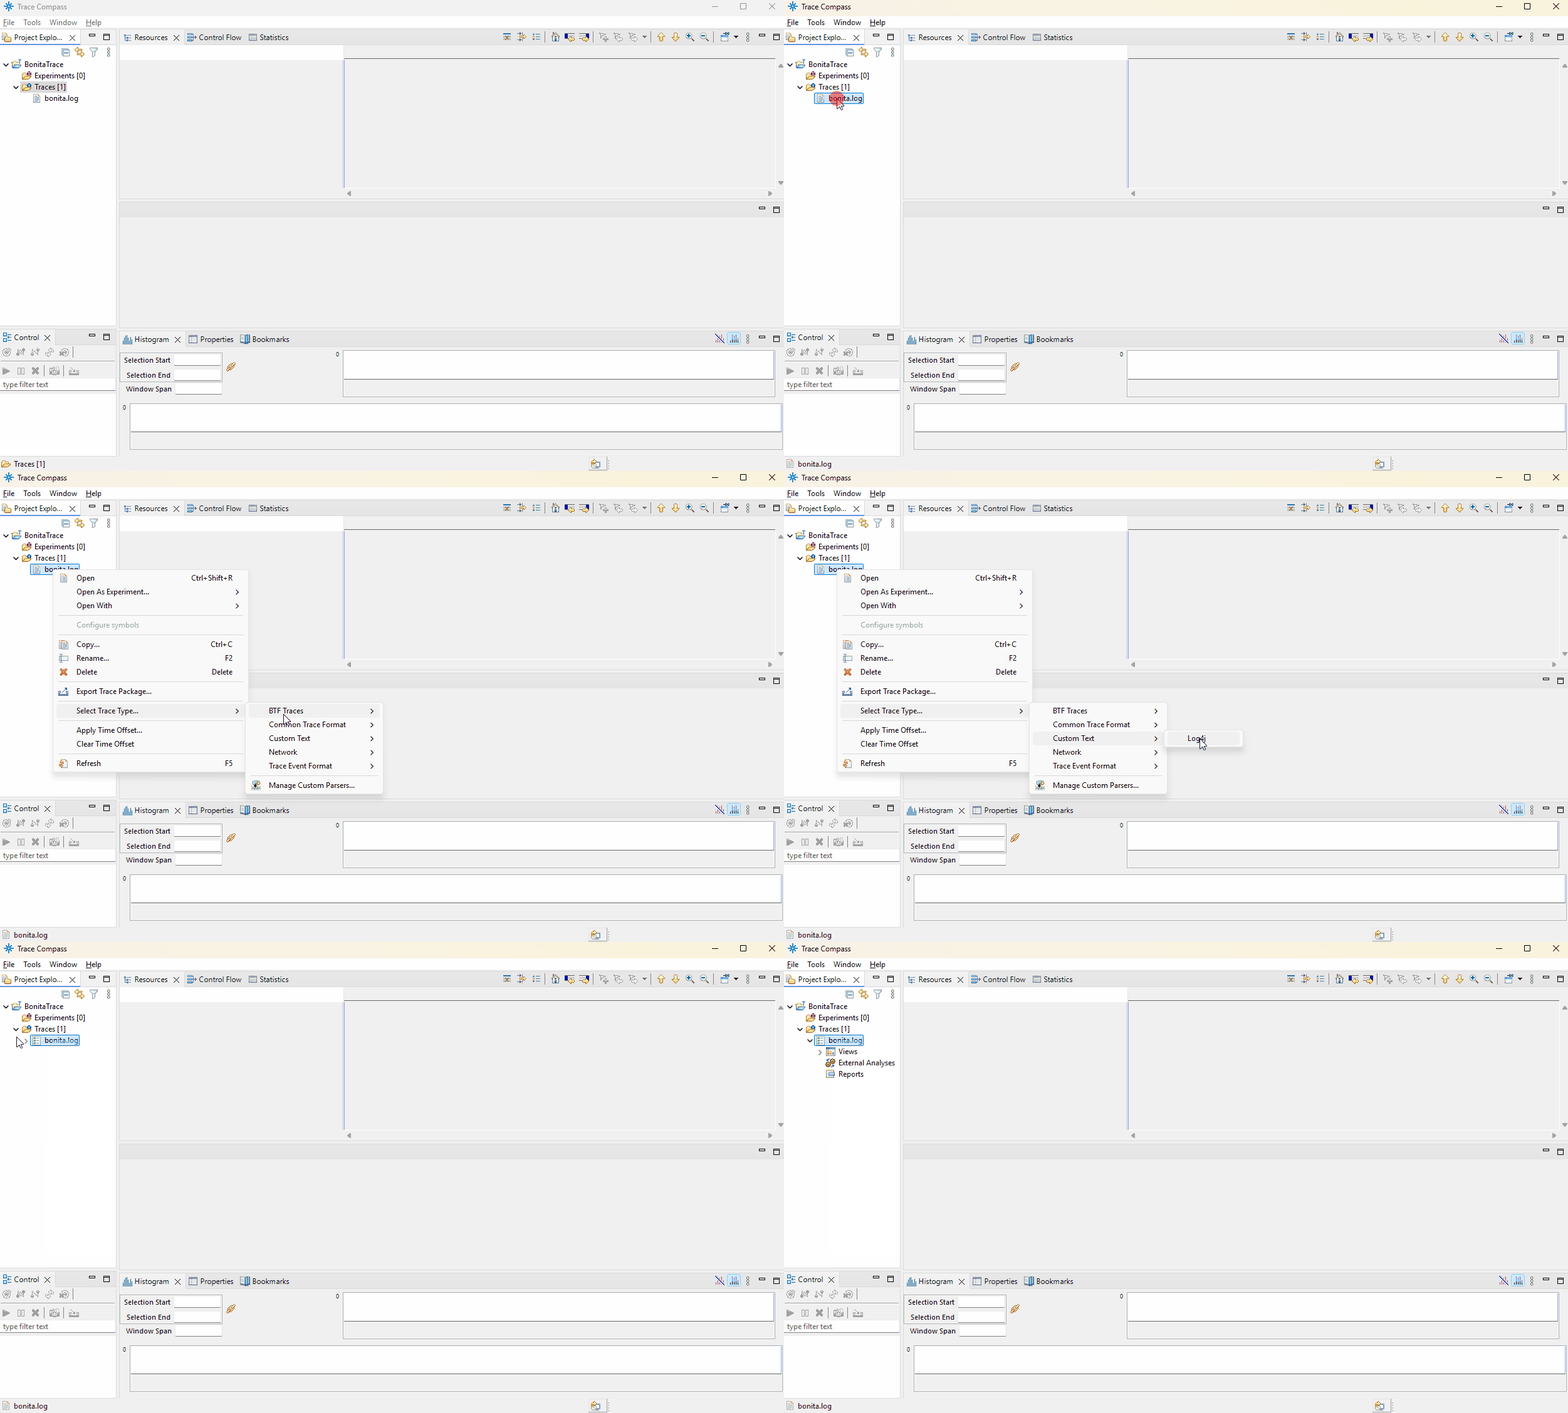
Select your custom parser for the trace type.

-
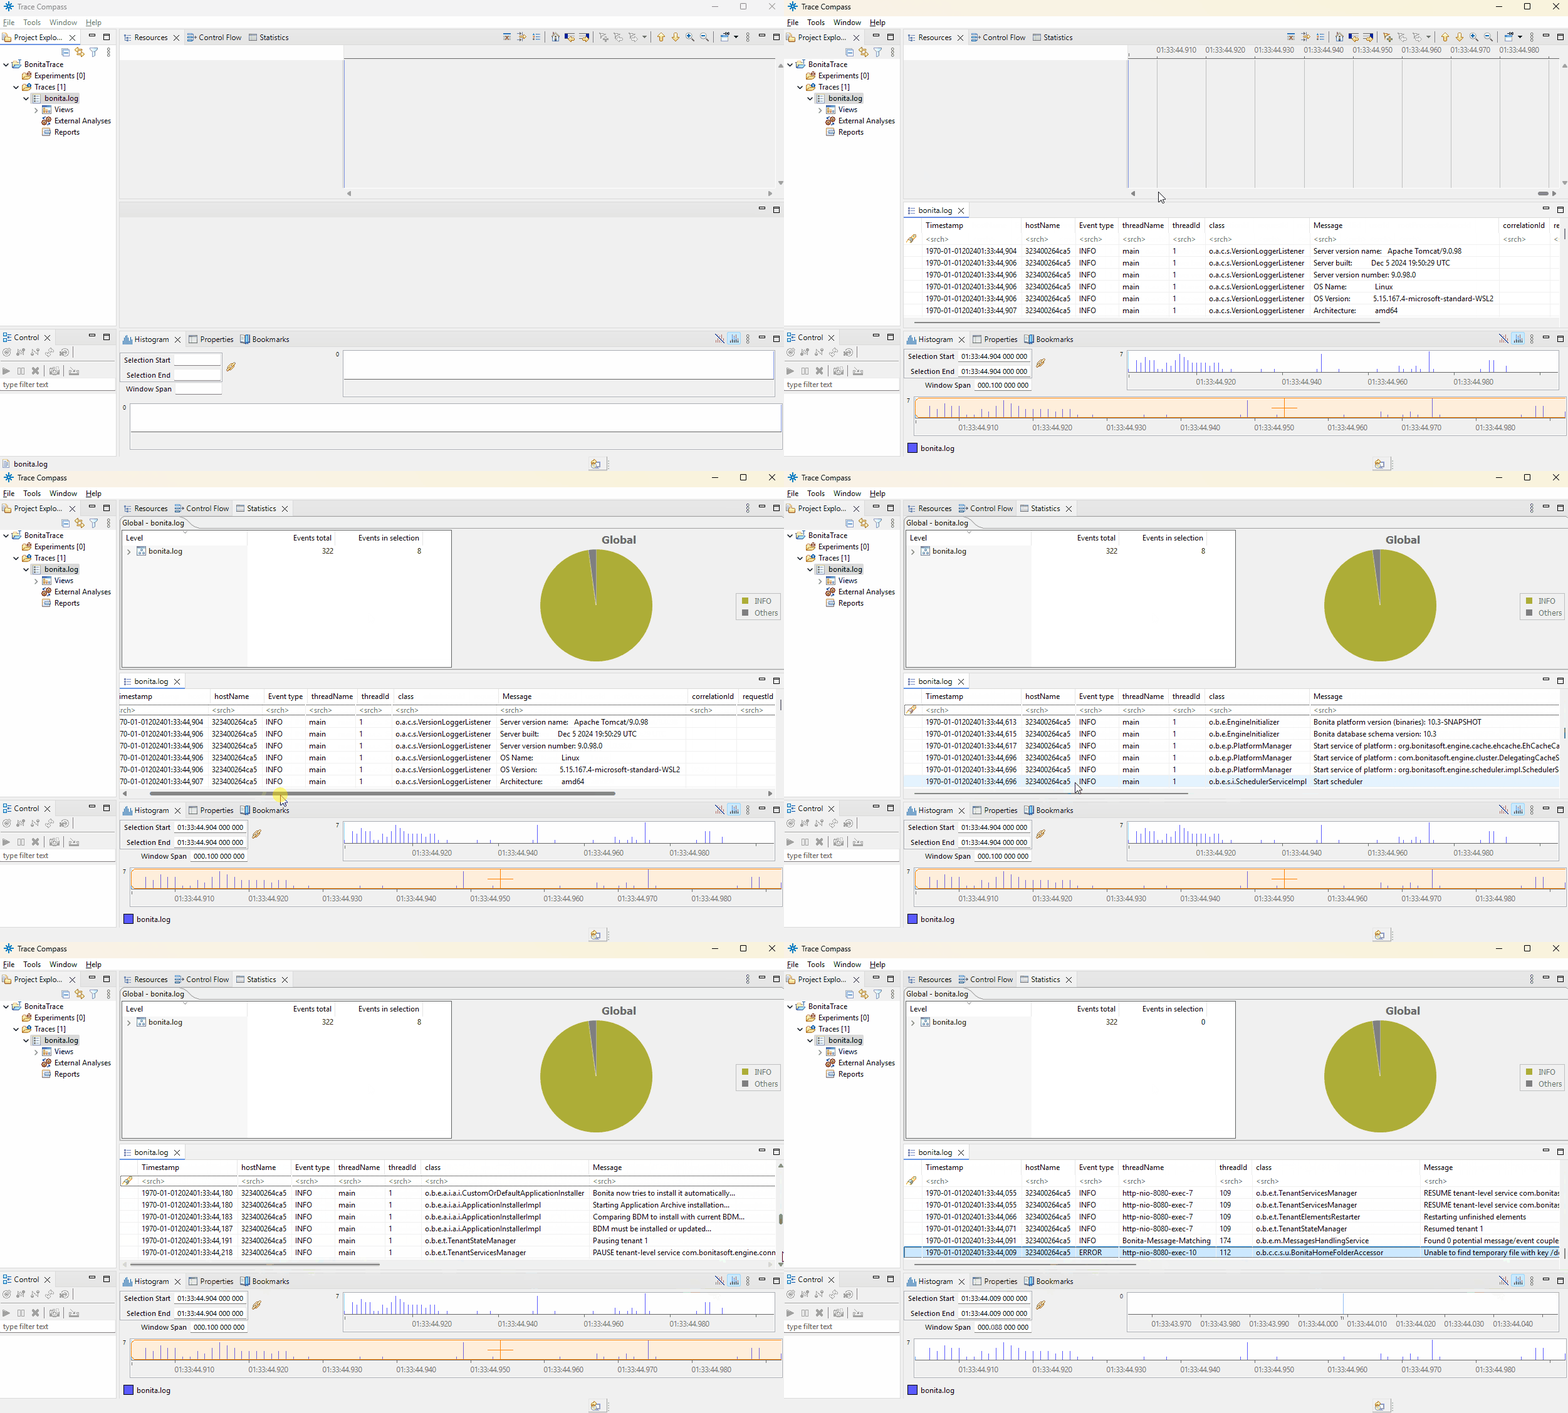
Open the trace to visualize.

You can also configure Trace Compass to visualize the logs live from a stream. Read the documentation for more information.