Administrator Case list
This page explains what a user with the _Administrator_ profile in Bonita Administrator Application can see and do about cases (the process instances).
Those users can view a list of open or archived cases, as well as cases with failures, access the case details and overview, the pending tasks for this case, the process definition of this case, and write a comment in open cases.
| Starting with Bonita 2022.2, bpmn-visualization library of Bonita’s Process Analytics project has been integrated in process and case visualization diagram. |
Here is a view of the page:
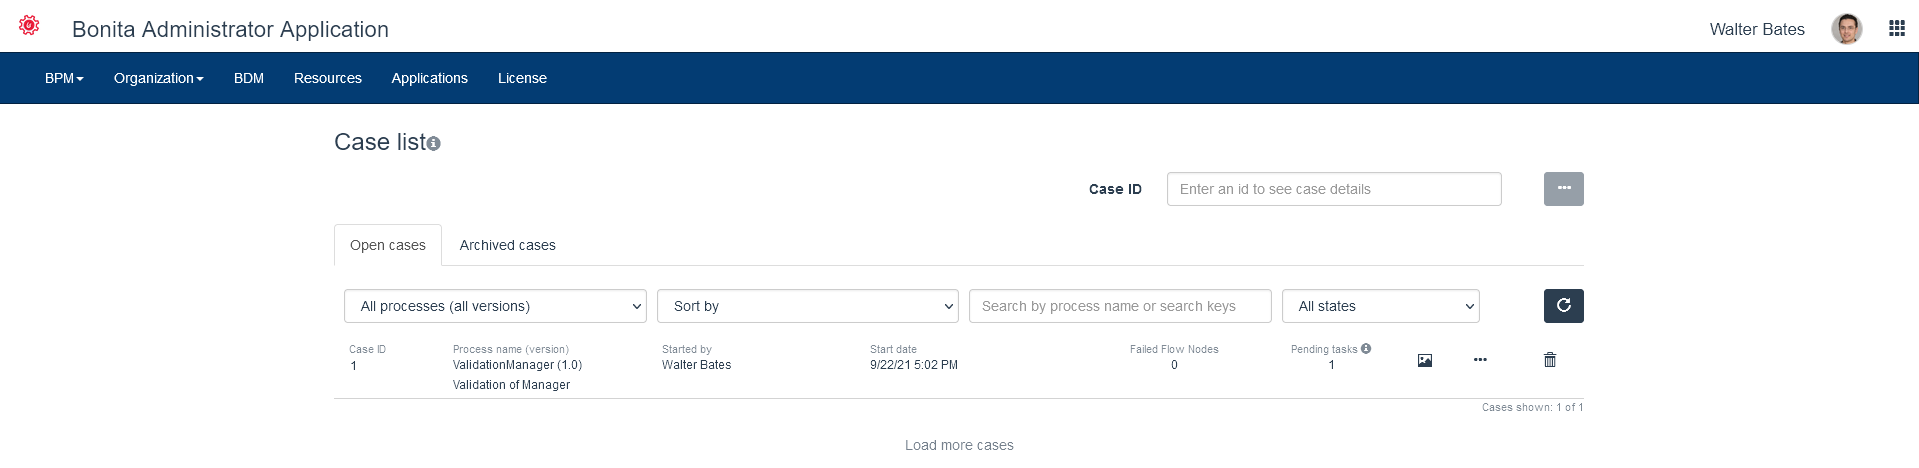
View the status of cases
To view the open or archived cases, go to BPM>Cases. The case table is displayed, showing the open cases. It is possible to choose between displaying only the root cases (this was the only option before Bonita 2025.1) and all the cases including the one started by call ativities.
-
To switch between Open cases and Archived cases cases, use the tabs.
-
View the cases of a specified process, by selecting the process name, or name and version, from the dropdown lists.
-
Search keys are also available as additional columns. In this way, you can use search keys for adding business information to your cases. It is also possible to search on search keys values.
-
Filter the cases by state, by choosing "With failures" or "All" from the State dropdown list.
The Failed tasks column shows the number of failed tasks. A connector failure at a task is counted as a task failure.
From this table, you can delete a case. Find the cases you want to delete, and click on the Delete icon. Confirm in the popup that you want to delete the selected case.
To open the case details page, click on a case id or the Eye icon. The case details page displays general information about the case, as well as monitoring information showing the number of done, pending, and failed flow nodes for the case and its possible child cases (started by call activities).
If you are using the Enterprise, Performance or Efficiency edition, you can also open the diagram of a case (case visualization), by clicking on the Picture icon for the case.
On the diagram, colored flags on the steps show the number of step instances in each state.
Put your mouse hover any step to see an explanation of the display.
Zoom in the diagram with either Ctrl+mouse wheel or the zoom buttons. If you are using a Mac with a Magic Mouse, prefer the zoom buttons.
Once zoomed in, you can drag the diagram.
Resize your browser window and click on the Reset button to fit the diagram to your window.
Remember that a failure at a step does not necessarily mean that the case has failed entirely, but it might indicate that some action is needed, perhaps to replay a connector.
You can customize the diagram page, or embed the BPMN diagram in your own page: see How to customize the display of process execution monitoring.
|
Error details
This feature is available with the Access, Enterprise, Efficiency or Performance editions.
In the case details page, when the case or a flow node of the case or a child case is failed, an additional "Error details" panel displays the information about the exception that caused the failure. When available, the scope and context of the error is attached to the failure to help locating the issue in the process definition. If the failure happened on a flow node, a link to the flow node details page is provided. A failure history is also displayed in case of successive failures in the case.