Monitor open cases
This page describes the "Monitor open cases" page in the Bonita Administrator Application.
In this page, Administrators and Process Managers can have a complete view of the sanity of the BPM operations, filter by process, access the process visualization and case details of a process.
|
For Enterprise, Performance and Efficiency editions only. |
Here is a view of the Monitoring page
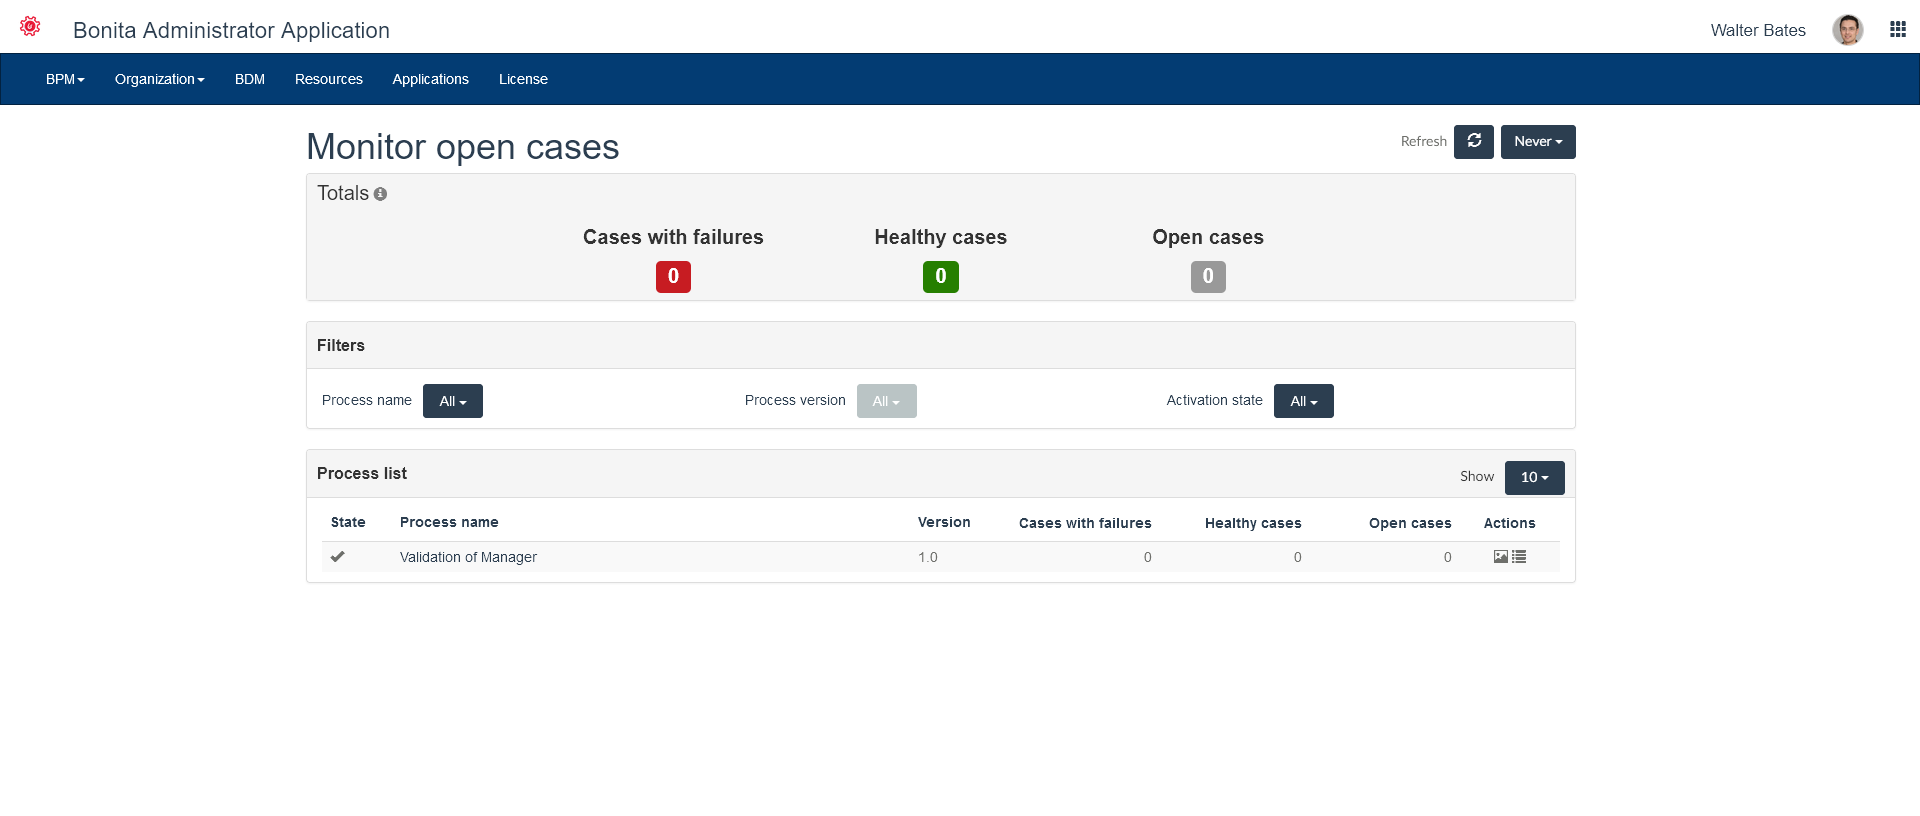
Go to BPM> Monitoring for Administrator and Monitoring for Process Manager. The Monitor open cases page is displayed, with the following summary information:
-
Number of cases with failure
-
Number of healthy cases
-
Number of open cases
-
A table of open cases
You can filter the table to show only a specified process, or process and version. You can also filter it by process activation state.
Process Managers can see only the processes they manage.
From a row in the table, you can click the List icon to see a list of cases of the process. You can also open a diagram of a process, by clicking on the Picture icon for the process. On the diagram, you can see the number and state of cases in progress at each step. Click on the Show key button to see an explanation of the display.
The process diagram is constructed from the deployed process definition. This means that some details visible in Bonita Studio, such as descriptions are not available.
|
Note: if a process was deployed from a .bar file created in Bonita Studio 6.3 or earlier, the diagram display is not available.
This is because some details of the |