Process User Insights
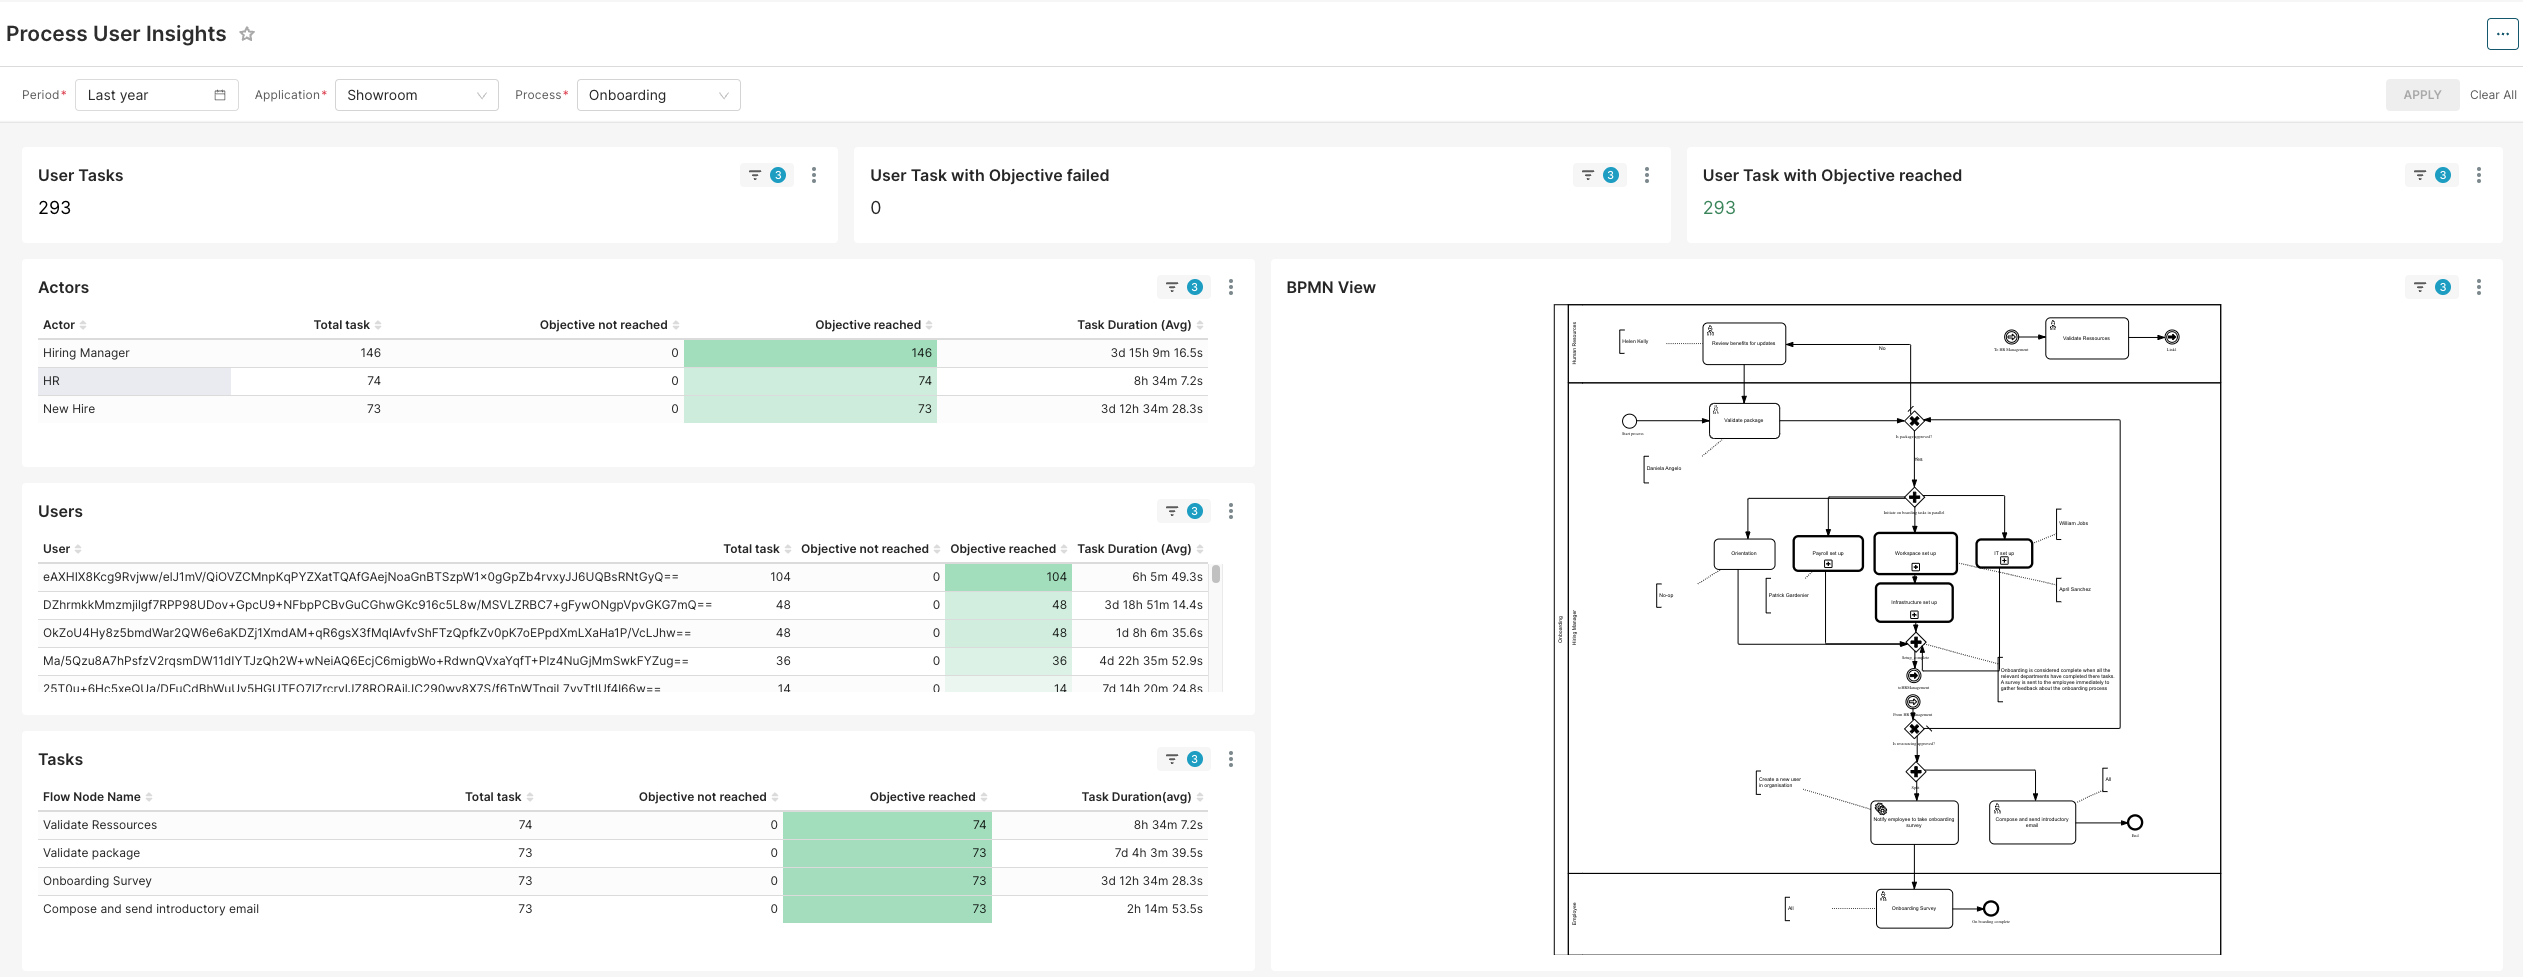
The Process User Insights dashboard is a comprehensive tool designed to provide a detailed analysis of the execution of business processes. This dashboard offers a visual and metric-driven representation of various aspects of the process, including task performance, actor involvement, and overall process efficiency. By utilizing this dashboard, stakeholders can monitor key performance indicators, identify areas for improvement, and ensure that business processes are executed effectively and efficiently.
Introduction
This documentation provides an exhaustive overview of the "Process User Insights" dashboard, detailing the various charts, visualizations, and key performance indicators (KPIs) used to analyze the execution of processes in a BPM (Business Process Management) context. The dashboard represents data for a specific process within the selected application over the last year.
Charts and Visual Representations
BPMN View
Description
The BPMN (Business Process Model and Notation) view is a graphical representation of the selected process flow. It illustrates the sequence of tasks, decision points, and interactions between different actors and systems.
Purpose
Provides a clear visualization of the process flow, helping stakeholders understand the sequence and dependencies of tasks.
Components
-
Start Event: Marks the beginning of the process.
-
Tasks: Rectangular shapes representing actions or activities (e.g., Validate Resources, Validate Package).
-
Decision Points (Gateways): Nodes where decisions are made, leading to different branches in the process.
-
End Event: Marks the completion of the process.
-
Swimlanes: Parallel lines that separate different actors or systems involved in the process.
Metrics and Key Performance Indicators (KPIs)
Key Metrics
Period
Data is aggregated for the last year.
Application
Choose the application you want to study.
Process
Select the process you want to study.
User Tasks
Total number of tasks performed by users.
User Tasks with Objective Failed
Number of tasks that failed to meet their objectives.
User Tasks with Objective Reached
Number of tasks that successfully met their objectives.
Actors Performance
This section lists the different actors involved in the process and their performance metrics.
For each actor (Hiring Manager, HR, New Hire) you will find these metrics:
-
Total Tasks: Total number of executed tasks.
-
Objective Not Reached: Number of tasks that did not reach the objective.
-
Objective Reached: Number of tasks that reached the objective.
-
Task Duration (Avg): Average task execution duration.
Users Performance
The users' performance details are anonymized. Each user is identified by a unique hash.
For each user you will find these metrics:
-
Total Tasks: Total number of executed tasks.
-
Objective Not Reached: Number of tasks that did not reach the objective.
-
Objective Reached: Number of tasks that reached the objective.
-
Task Duration (Avg): Average task execution duration.
Task Performance
This section breaks down the tasks by their specific flow nodes within the process.
For each flow node you will find these metrics:
-
Total Tasks: Total number of executed tasks.
-
Objective Not Reached: Number of tasks that did not reach the objective.
-
Objective Reached: Number of tasks that reached the objective.
-
Task Duration (Avg): Average task execution duration.
Conclusion
The Process User Insights dashboard provides a detailed view of the execution of the process you want to study within the selected application. By analyzing the various charts, visualizations, and key performance metrics, stakeholders can gain valuable insights into the efficiency and effectiveness of the process. Regular monitoring of this dashboard can help in identifying areas for improvement and ensuring the continuous optimization of business processes.