Process overview
This document serves as a comprehensive guide for understanding and utilizing the BPM Dashboard for effective process management. It provides detailed insights into the various charts and metrics presented on the dashboard, facilitating a deep understanding of the process execution within the BPM context.
The Overview Dashboard is a powerful tool for gaining deep visibility into business processes, monitoring performance, and driving continuous improvement initiatives.
Whether you’re a process owner, analyst, or executive, this dashboard equips you with the insights you need to optimize processes and achieve operational excellence.
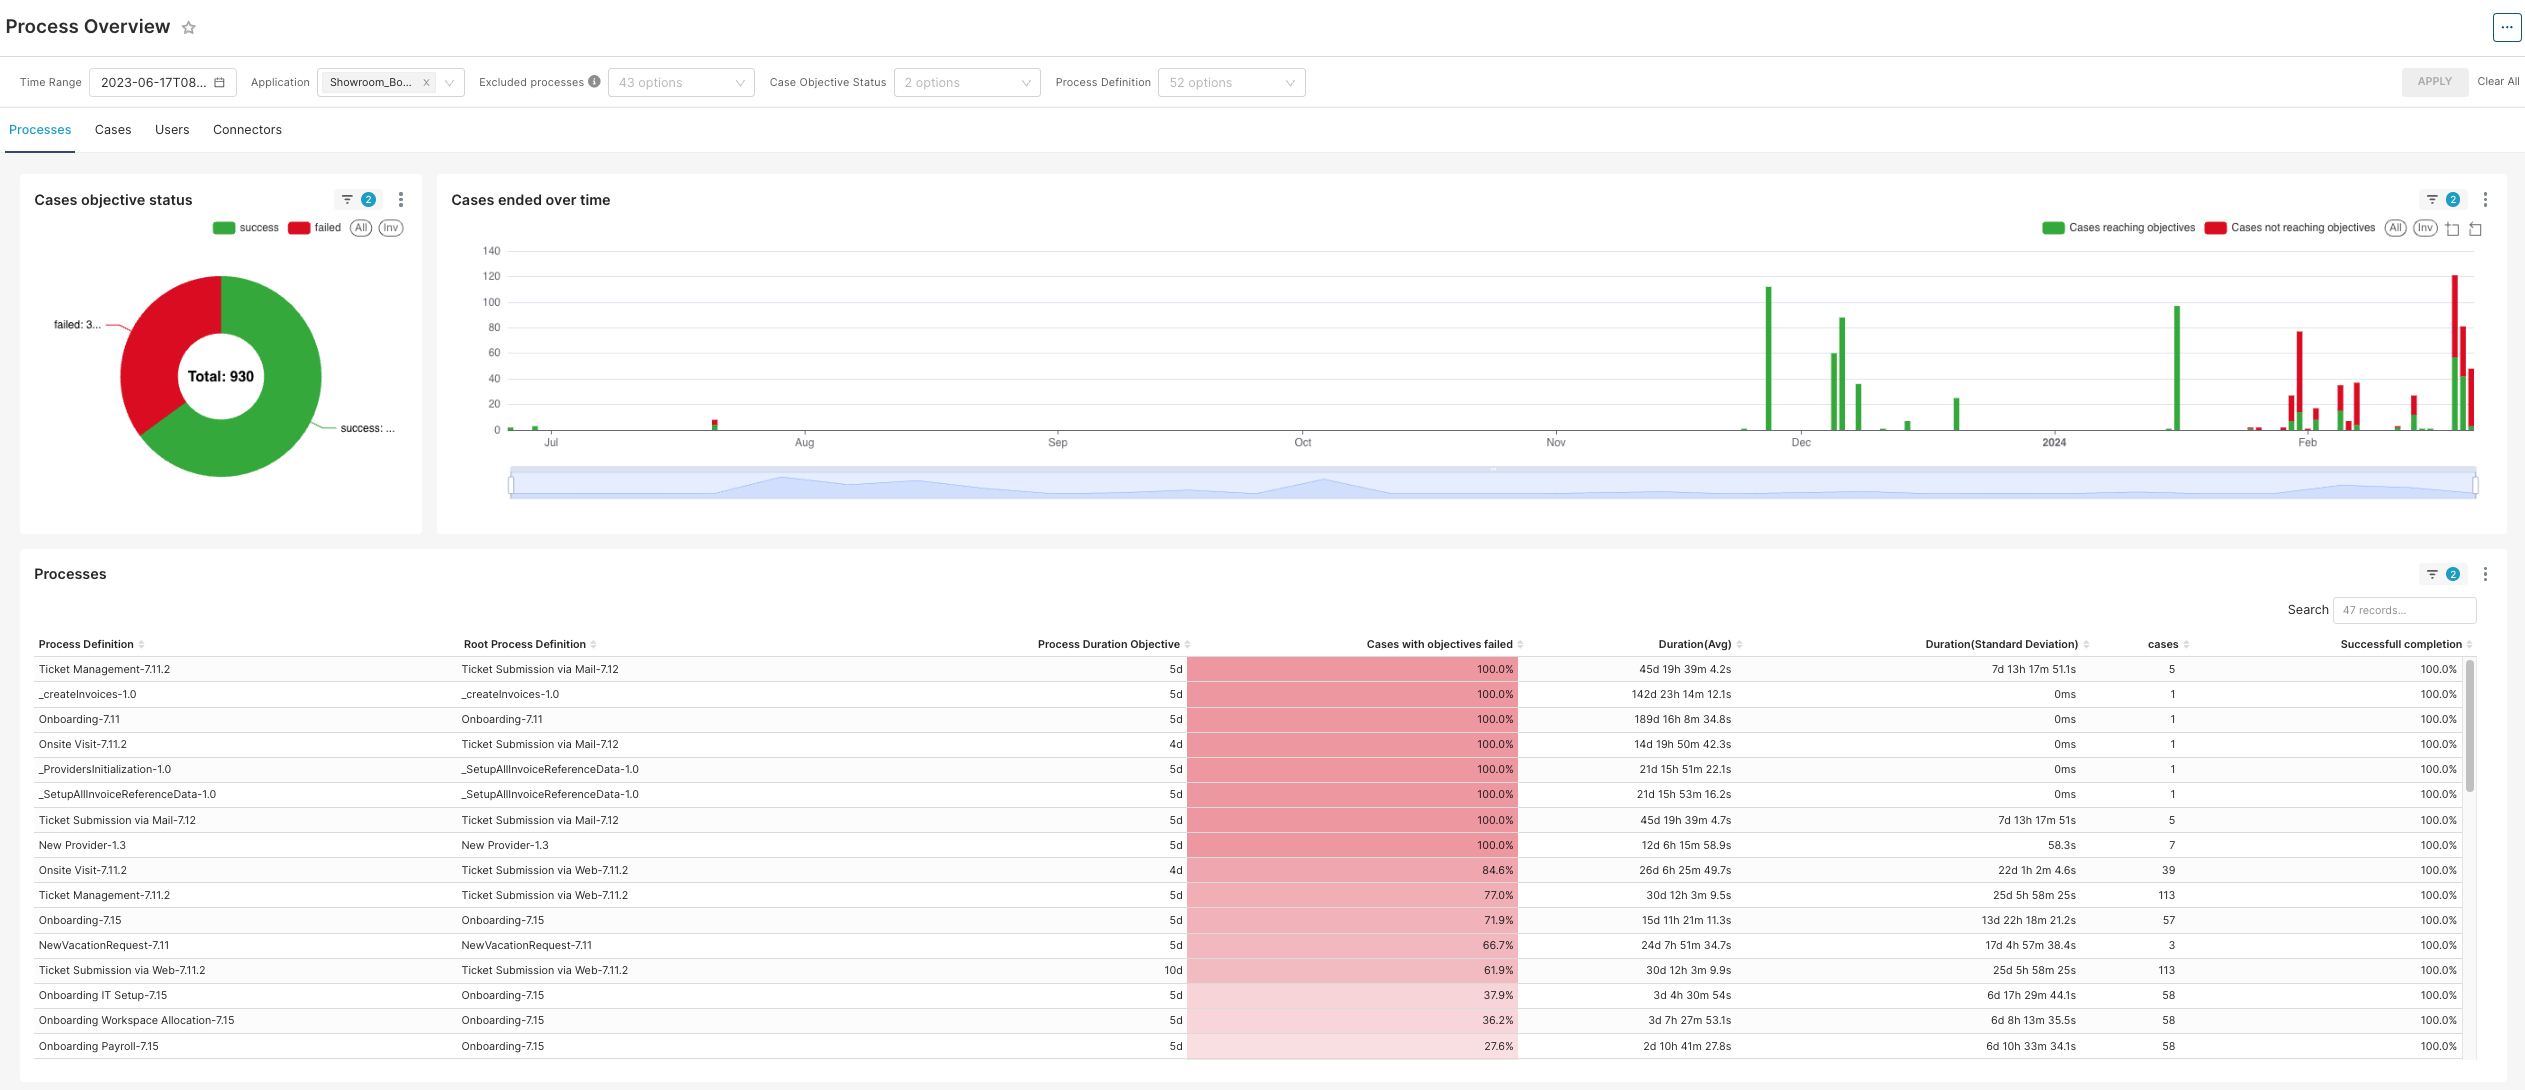
Chart Analysis
Cases Objective Status (pie chart)
Description: This chart provides a visual representation of the proportion of cases that have met their objectives versus those that have not.
Purpose: To give stakeholders an immediate sense of process success rates and highlight areas requiring attention.
Cases Ended Over Time (Bar Graph)
Description: This graph illustrates the number of cases concluded over a selected time period, differentiated by whether they have met their objectives.
Purpose: To track and analyze the flow of process completion over time, identifying any patterns or irregularities.
Metrics and KPI analysis
Process Definition Metrics
Description: Lists all the processes by their unique identifiers and provides a snapshot of their current status.
Metrics Included:
-
Process Name: The name of the process being executed.
-
Root Process Definition: Indicates the originating process from which a given subprocess derives.
-
Duration Objective: Targeted time for process completion.
Performance Metrics
Description: These metrics provide a deeper dive into the performance and efficiency of each process.
Metrics and KPIs Included:
-
Duration (Avg): The average time taken for a process to complete.
-
Duration (Standard Deviation): The variability of the process duration from the average.
-
Cases: The count of process instances.
-
Successful Completion %: The percentage of processes that met their objectives successfully.
Process Variants Analysis
Introduction
This documentation delves into the analysis of business process variants using the BPM dashboard metrics, focusing on adherence to temporal objectives—predefined maximum durations for process execution. The document aims to elucidate the performance of each variant and provide actionable insights.
Dashboard Analysis
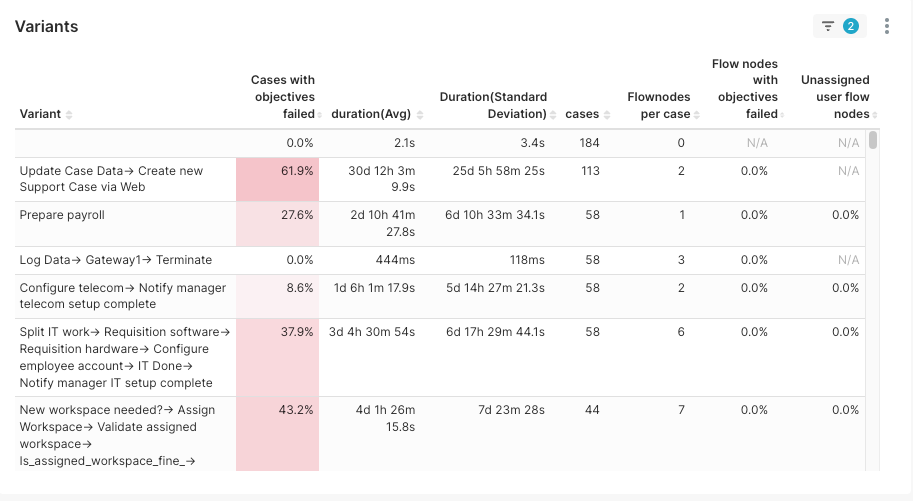
Variants
The individual business processes monitored for performance, each with a distinct sequence of tasks and expected outcomes.
Temporal Objectives
Indicates whether the process variants are completed within the target duration set for the process, with a specific focus on the percentage of cases meeting these temporal objectives.
Average Duration
Reflects the mean time taken for a process variant to reach completion across all instances.
Standard Deviation of Duration
Quantifies the variation in process duration from the mean, indicating consistency or variability in process execution time.
Detailed Analysis
High Objective Failure Rates
The 'Update Case Data → Create new Support Case via Web' variant has a notably high failure rate (61.9%), significantly exceeding its temporal objectives. This suggests a critical need for process reevaluation.
Process Execution Time
Variants with extended average durations and high standard deviations are prone to be inconsistent with their temporal objectives. These may require streamlining or additional resources to improve time efficiency.
Complexity and User Assignment
Variants with numerous flow nodes may be inherently complex, affecting the execution time. Furthermore, instances of unassigned user flow nodes could indicate unclear process ownership, contributing to delays.
Recommendations
-
Conduct a root cause analysis for variants failing temporal objectives, such as the 'Update Case Data' variant, to identify and rectify inefficiencies.
-
Standardize and possibly automate parts of the process to reduce the standard deviation in process duration, thereby increasing predictability and consistency.
-
Review and clarify user responsibilities for all flow nodes to ensure accountability and minimize unassigned tasks.
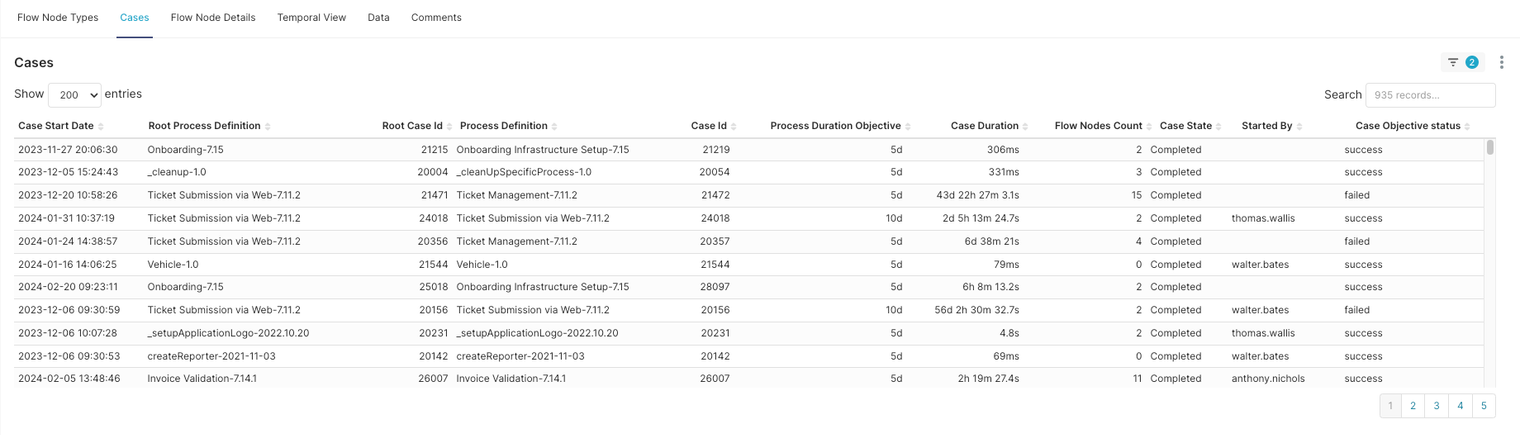
Cases
Introduction
This document provides a detailed overview of individual business process cases as represented in the BPM dashboard. The focus is on the performance of each case with respect to the temporal objectives, which are predetermined time frames for process completion.
Dashboard Data Points
Case Start Date: The date and time when the case was initiated.
Root Process Definition: The fundamental process template or blueprint from which the case was created.
Root Case Id: The unique identifier for the primary case associated with the process.
Process Definition: The specific definition or version of the process being executed.
Case Id: The unique identifier for the specific instance of the process.
Process Duration Objective: The target time frame within which the process is expected to be completed.
Case Duration: The actual time taken from the start to the completion of the case.
Case State: The current status of the case (e.g., Completed, In Progress, etc.).
Started By: The individual or entity that initiated the case.
Case Objective Status: Indicates whether the case was completed within the temporal objectives (success or failed).
Detailed Analysis
Adherence to Temporal Objectives
The 'Case Objective Status' column is crucial in determining the efficiency of process executions. Any case with a 'failed' status indicates a breach of the temporal objectives, warranting further investigation.
Case Duration Insights
Comparing 'Case Duration' against 'Process Duration Objective' provides insights into process efficiency and the effectiveness of time management within cases.
Identification of Patterns
Recurring 'failed' statuses in cases with the same 'Root Process Definition' may point to systemic issues in specific process templates.
Recommendations
-
For cases exceeding the 'Process Duration Objective', conduct a detailed review to identify bottlenecks or inefficiencies.
-
Investigate any commonalities among failed cases, such as process definitions or starters, to pinpoint areas for process optimization.