Application Insights
This documentation provides a detailed overview of the Application Insights dashboard, helping stakeholders understand and utilize the insights effectively to improve process performance and efficiency in the BPM context.
Introduction
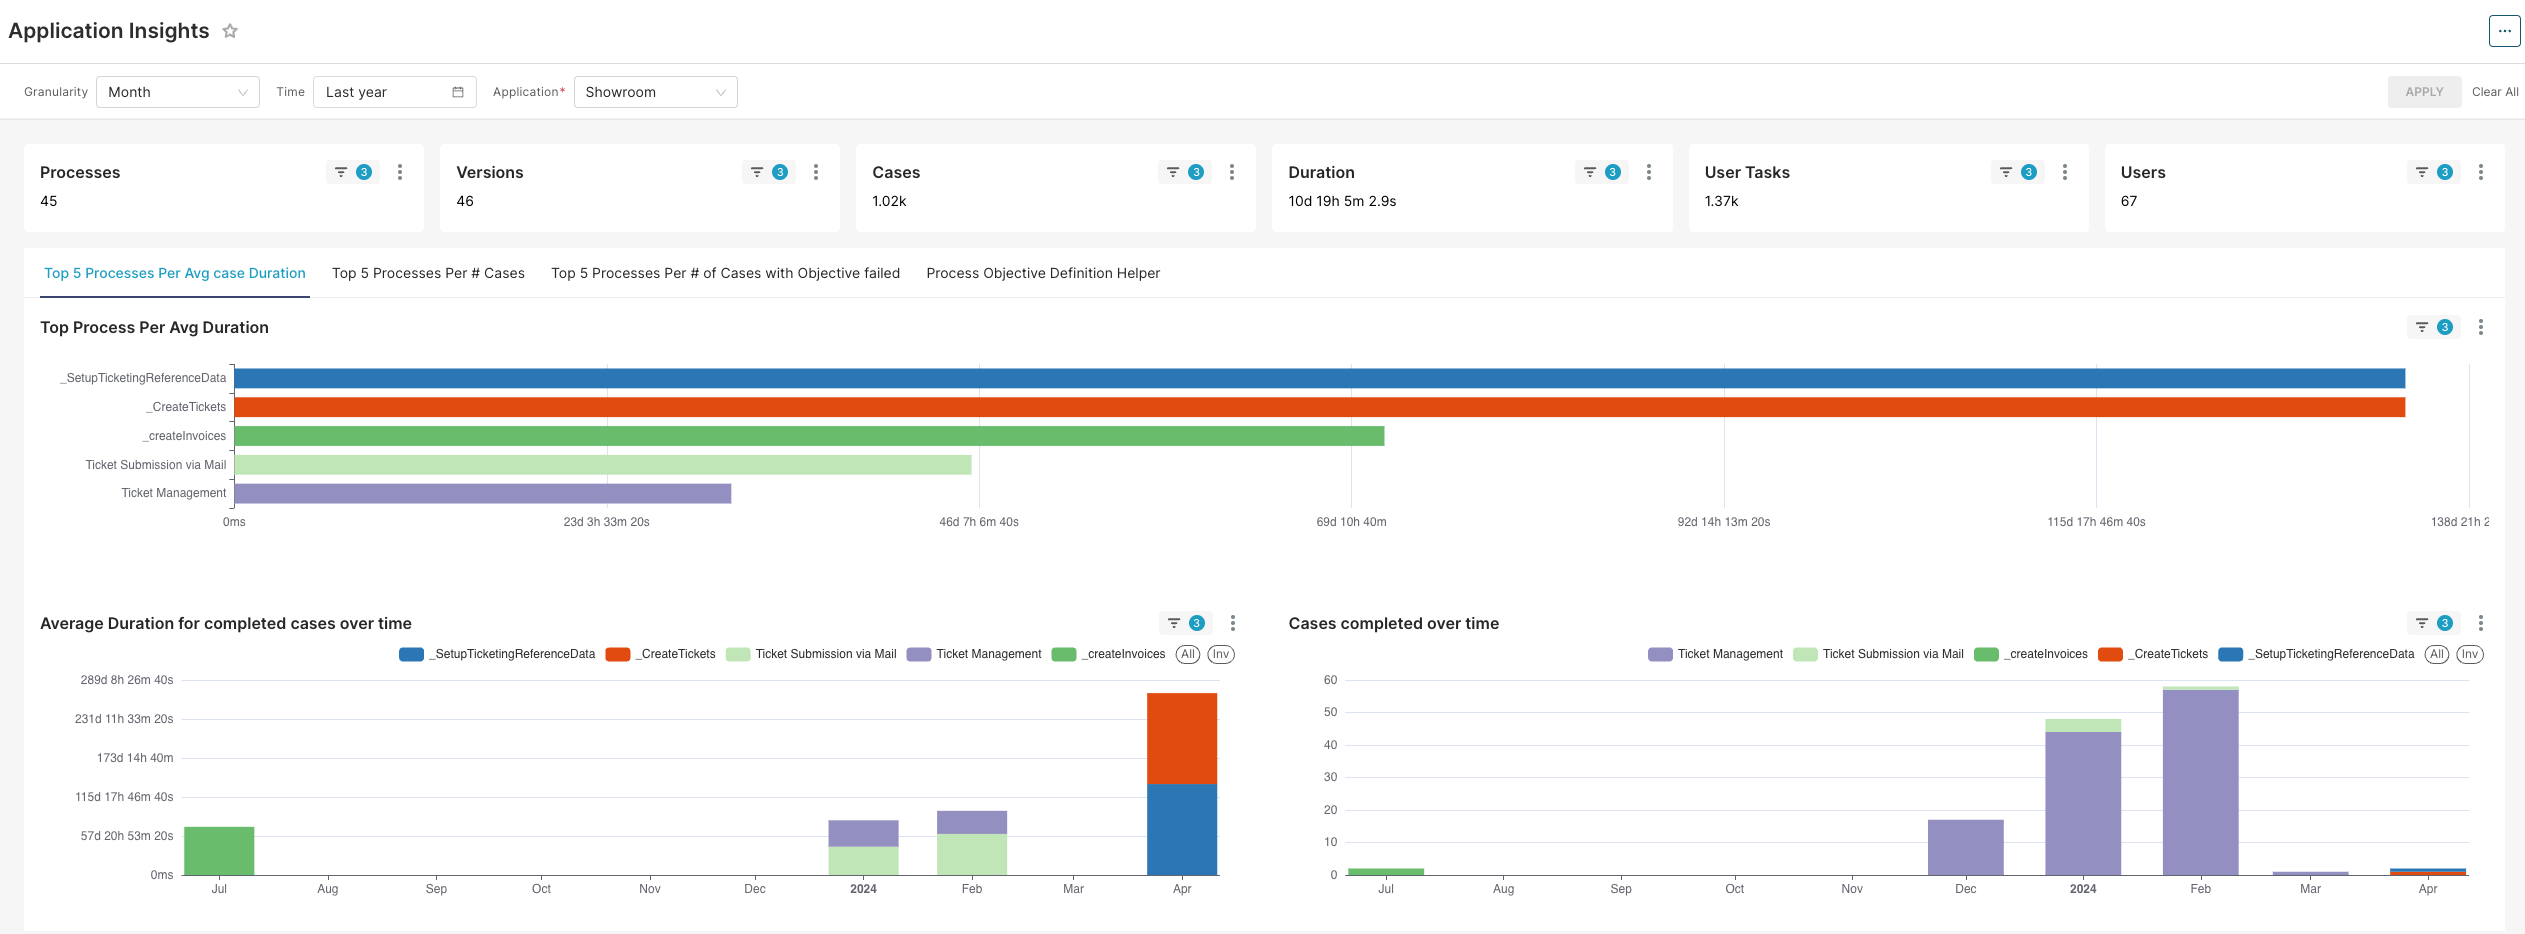
The Application Insights dashboard provides a comprehensive view of the process execution within a BPM (Business Process Management) context. It includes various charts and key performance indicators (KPIs) to help analyze and monitor the performance and efficiency of different processes. This document details the different components of the dashboard, including charts, metrics, and KPIs.
Charts
Top Processes by Average Duration
Description
-
This bar chart displays the average duration for the top 5 processes.
-
Each bar represents a different process, with the length of the bar indicating the average time taken to complete the process.
Insights
You can observe which of your processes have the highest average duration.
Average Duration for Completed Cases Over Time
Description
-
This line chart shows the average duration for completed cases over time for various processes.
-
The x-axis represents time (monthly), and the y-axis represents the average duration.
Insights
You can observe the behavior of your processes over time, allowing you to determine the distribution of your activity (seasonality, peak load, etc.).
Metrics & KPIs
-
Processes: The total number of distinct processes being tracked and analyzed in the dashboard.
-
Versions: The total number of different versions of the processes being tracked.
-
Cases: The total number of cases executed within the selected time frame.
-
Duration: The cumulative duration for all processes within the selected time frame.
-
User Tasks: The total number of user tasks completed within the selected time frame.
-
Users: The total number of users who participated in the processes within the selected time frame.
Filters
Description
Filters applied to the data to refine and focus the analysis. Filters are available for Processes, Versions, Cases, Duration, User Tasks, and Users. These filters help in narrowing down specific data points for more precise insights.
Filter Options
-
Granularity: Month
-
Time: Last year
-
Application: Select the application you want to study
Recommendations
Process Analysis and Optimization
-
Conduct a detailed analysis of processes with high average durations (e.g., SetupTicketingReferenceData, CreateTickets) to identify inefficiencies and areas for improvement.
-
Implement process improvement techniques such as Lean or Six Sigma.
Resource Allocation
-
Review workload distribution among users to ensure no overload and tasks are evenly distributed.
-
Consider automating repetitive tasks to reduce the manual workload on users.